Introduction to Power BI
Table of Contents
Business Intelligence
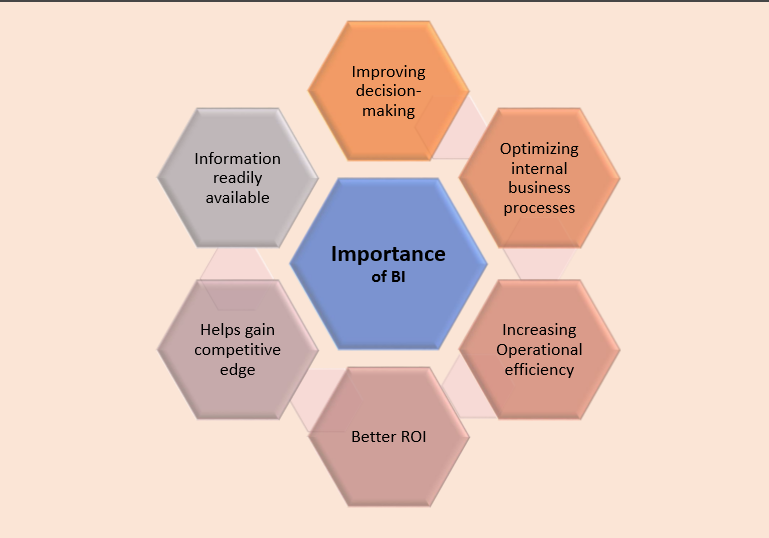
- Business Intelligence (BI) is a process of analyzing data through technology and presenting it to the end-user(s) which helps them to make an informed decision. With the use of historical and current data, a BI tool serves predictive view.
- Usually, a BI tool can perform tasks like data connection, data mining, data transformation, data modeling through building relationships, complex calculations, report building, dashboard creation, online analytical processing, and predictive analysis.

BI Tools
- Microsoft Power BI
- Tableau
- Sisense
- Looker
- Datapine
- ZohoAnalytics
- Yellowfin
- Answer Dock
- Report Plus
- QlikView
- SAP BusinessObjects Lumira
- SAP Crystal Reports
- SAP Business Intelligence
- Vista
- Clootrack
- Hotjar
ETL
Extract
The first step in using Data Warehousing is to extract data from single or multiple sources to load in its environment.
Transform
The Data which has been extracted, may not come in the desired format or size, etc, so there may be the need to transform the incoming data to meet business requirements and objects.
Load
Once the data is being transformed, it’s ready to be loaded in targeted tables.
Prerequisites for Power BI
• There is no basic requisite for learning Power BI except for some basic knowledge of MS Excel.
• Knowledge Pivot Table, Look Up Function, Function like sum, average, Count, Use of Filters formatting will be helpful to learn it faster.
• Knowledge of power query will be a great help in cleaning and processing the data.
Why Choose Power BI over Excel
- Store and analyze huge amount of data smoothly: With powerful compression algorithms to import and cache the data within the.PBIX file, it can easily handle huge databases. On the other hand, Excel struggles even in opening a file having few hundred thousand of rows.
- Find Data insights and show trends in minutes: With build-in time intelligence functions, it becomes very easy to dig into a vast amount of data and draw trends (unlike Excel).
- User-Friendly Report Interface: It’s just about the drag and drop of the fields when it comes to create impressive visualizations. Even a complex report with diverse visualizations won’t take more than 10 to 20 mins to create. If you think that pre-enabled visualizations are not enough then you can import a custom visualization anytime in just a few clicks from the library of 100’s of custom visuals.
- Publishing and Sharing the Report: Just by hitting the publish button, one can publish the report on the Power BI service and whosoever has an access to it can view the updated report or dashboard always. On the other hand in Excel, one needs to send emails or putting in the share drive or share point and telling them that we have updated the file.
- Defining Roles: Power BI gives us an option to define roles to make sure people from different departments or locations can see only their respective data (Which can’t be done in Excel).
What will be covered in Power BI Course
- How to download Power BI
- Understanding of various Versions of Power BI
- How to Import, transform and load data into Power BI
- How to build connections between various data
- How to build multiple dashboards using various visuals and graphs.
- How to play with your dashboards to give detailed information
- How to publish and share your reports
Read & Download the full Copy in pdf:
 CA Rohan Mehta
Mr. Rohan Mehta is a fellow member of the Institute of Chartered Accountants of India. He has also completed certified course on Forensic Accounting and Fraud Detection (FAFD). He has a good knowledge of company law and specialises in statutory audits under companies act. He has also led several process improvement projects and assisted in implementation of internal controls (including design of fraud risk controls) across various industries. He has almost a decades experience working as a trusted advisor with the finance function of several organisations and providing value added services to CFO's office.


